

How can we Help?

Home Page
The home page will display a summary of all events in a list or calendar form. These can be toggled using the blue button.
You can return to this home page at any time by clicking Home in the left menu.

Scheduled Event
Events can be schedule by clicking on the "Add Event" button and setting up an event with a future date, or firstly selecting the date the event should take place on the calendar and pressing the "Add Event". Either of these will open a schedule box with the following options.
Site: Select the site
Record Date : The date to be scheduled for.
SOP Document: If applicable, select the SOP document which applies to the monitoring (see Documents for more)
Repeat: select if you want to set up a reoccurrence
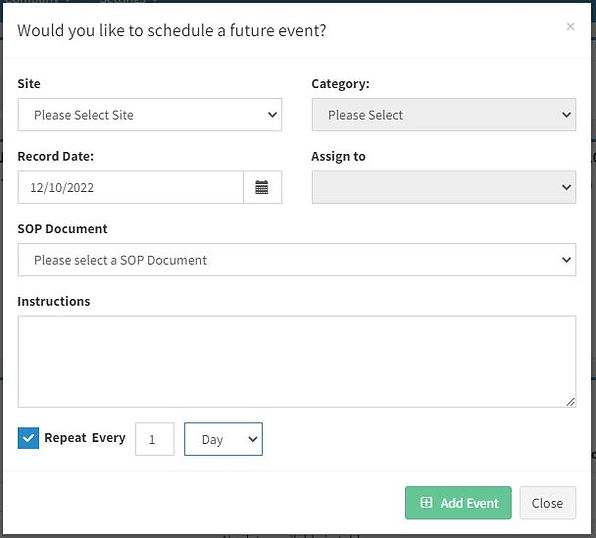
Category: Select the category and event of the monitoring event.
Assign to: Select the user to assign responsibility of this monitoring event, this can be an employee or a Groundwork Plus officer
Instructions: Leave instructions for the sampler, these will be displayed in the monitoring event
Add Event: when finished set up press add event, this will now be available in you calendar
Change a Scheduled Event
If details about a scheduled event are to change, select the event in the calendar. It will appear in the Event Details List. Select Edit. Changes can be made and a selection as to whether those changes apply to the one event or all future events must be made.

Desktop Data Event Entry
A new event can be started from the home screen by selecting todays or a past date in the calendar and pressing “Add Event” button or selecting "Add Event" and using the pop up screen to select the sampling date.
Once an event has been added, a spreadsheet is provided to fill in data. This data can also be copied and pasted into multiple field boxes. If further parameters or locations are required, contact GPlus Live Team or your sites administration.
Dates: Finish date is recorded as the date of sampling, if the event took place over multiple days also record a start date. Where know, record time of sampling.
Variables: Monitoring variables are displayed vertically.
Comments: Record any comments during sampling (flow rate, colour, odour etc)
Files: Upload a photo relating to the specific station
Lab timeframes : Should sampled be sent to a external laboratory, important milestone dates can be recorded.

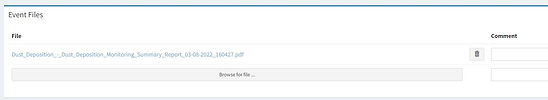
Event Files : Upload files relating to the event as a whole, lab certificates, reporting, maps, further notes etc.
Purpose: Provided on set up of the category, a description of the purpose of the monitoring to help inform the sampler and reporting.
SOP: If attached, this SOP document can be downloaded to instruct sampler of correct sampling protocol
Stations : Monitoring stations (i.e. locations, sites etc.) are displayed horizontally.
Data fields: Enter data into blank fields. Where no data is available, leave box blank.
Calculated fields are grey and will automatically populate on the required data being entered.
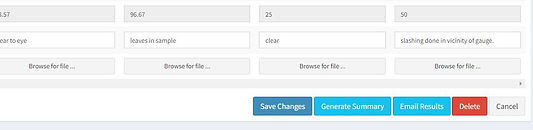
Save : Select Final Save (to approve) or Preliminary Save
Weather Data : record weather data sources from BOM or onsite station.
Field Data Entry
If data is being entered in the field, the field data view is easier to view on a mobile or tablet. It will also work offline should internet be unreliable. You will need to select the site while still with internet connection and will need to reconnect to Finish or Final save the data to the data base. Preliminary save should selected between stations. The field enter page is found under the Data menu item.
Photo Event Entry

File Comments: Include your comments on the photo
Save : Select Final Save (to approve) or Preliminary Save
Comments: Section to provide overall comment on the event
Stations : Monitoring stations (i.e. photo locations) are displayed vertically.
Files : Upload up to 5 photos to each station
Event Files : Upload files relating to the event as a whole, lab certificates, reporting, maps, further notes etc.
Adding a new photo monitoring event is done the same as a data event. The screen will appear as below. These events are useful for tracking changes over time or recording observations during site visits. Fixed stations (photo locations) are displayed with the ability to add up to 5 photos at that location. Click 'Browse for file', and select the photograph or drag and drop the file into the grey box. If you are working on a mobile device with a camera, you will be directed to your photos or camera and can store the photo directly to the site. There is also the option to record comments for each photo.
Form Event
Some events, such as inspections, audits or checks, can be set up as a form, they are called Compliance events in the system. They will appear with the question, item down the left site and the 'fill' box on the right. The 'fill box' can be a text box, long or short, drop down list, check box, date, number or file upload. These will be present on set up.


Forms can be linked to Triggers where if a trigger is met a form is created to ensure the correct information is recorded, investigation is undertaken or notification information gathered. This form will be emailed and linked to the event by a hyperlink. See Triggers for more infomation.
Event Status
All events will have a Status, with the final being Approved.
Pending Approval (Preliminary Save)
All monitoring events and users will have a option at the bottom of the events entry page for Preliminary Save.
Clicking Preliminary save, you can select if you would like to send an email to an chosen user to asking to log in and approve the data. This will change the event to Pending approval status and appear on the list on the home page. While data is pending approval it will not be available on the report or summary reporting.
If you wish to Save data and come back to it later not ticking send for approval and preliminary save will change the events status to Event in Progress and add it to the work in progress list on the home page. Once again, the data will not be avlible for reporting until Final Save (Approve) is selected.
Future or Recurring event
This event has not been started yet but has been scheduled for a future date, either as a stand allow or automatically through setting up a repeat or reoccurrence. The details button will not be available for these events as the event has not started. You can edit these events by pressing edit within the event details list.
Note if a scheduled event is being completed before the date it was scheduled, please edit the scheduled event to the date is will / has been done. If this date is today or in the past, it will open the event and you can select the details button. If this process is not done, your scheduled event will become an overdue event even though the event was undertaken.
Work or Event In Progress
Events will be marked as in progress if:
- Awaiting laboratory results, expected dates will be seen on the home page
- Groundwork Plus reporting has been requested
- An event needs to be approved but has not been send for approval to another user.
Select the details button in the list to go to the event.
Approved or Finalised Events
Once data is entered and the sampler or supervisor selects Final Save (Approve) the data is available for use in data download, summary report generation and graphing. If, however, reporting is required or laboratory data is still pending the event may still be an Event in Progress until such time as the final dates for lab data and / or reporting have been entered.
Accessing Data
Multiple data events can be downloaded and viewed online in a table format for graphed. They can also be downloaded to excel.
Access data through the Compliance menu items, select reports, set your criteria and press submit.
In the top right you will have access to graphing and downloads. You can also generate a summary report for the selected period (refer to Summary reports for more information).
Graphing
Within the graphing page your can filter the stations and variable showing on the graph. You can also use the Compare Variables to create graphs showing two variables on one graph. Right click and select copy image or save image to use the graphing in an external document.
Select Report to return to the data table.
Export to Excel
Clicking Export to excel will start a download of the data. This will be available in your download folder or browser.
The excel spreadsheet will show triggers by highlighting and providing a note on the trigger details. Right click on the cell, delete note and change to normal style to remove this from the table.
Summary Report
System generated summary reports can be created by:
Events Page : will create a summary report for that event alone. Includes Details, map, purpose, data summary, graphs and discussion (where provided). This is available in the Events Files section and is downloaded as a PDF. It will also be available under Documents, Summary Reports.
If you would like more control of what is reported or report over multiple events use the Generate Summary reports below.
Documents - Summaries: Click on Generate Summary and select a data range. If your date range encompasses more than one event these will all be summarized in the one report. A discussion about all the data for the events can be written into the discussion sections. You can also adjust variables and stations which will be displayed in the report. Pressing Save will create the report and be available for download in the list.

Triggers
Where your monitoring requires limits or triggers to be set, either by conditions of approvals or by choice, these will need to be set up by users with Administration permission or Groundwork Plus Administrators. Administrators will also need to know who will require notification of data outside these limits.
Once they have been applied, any data entered outside of these limits will be highlighted by a coloured box. These boxes colours indicate trigger types. The colour code is presented below in order of priority (ie. If multiple triggers are reached it will notify you of the highest priority). Notification will also be sent to nominated users in the chosen format for the type (set up and changed by Groundwork Plus Admin Team). Other specific trigger types may be added to your site depending on requirements.
Compliance Limit - nominated users will receive an immediate email, text msg to notify of the trigger and the trigger will show on the Notifications page
Nominated Limit - nominated users will receive an immediate email and the trigger will show on the Notifications page
Investigation Limit - nominated users will receive an immediate email and the trigger will show on the Notifications page
Setting Up Triggers
Under Locations in the top menu, click on Triggers.
Select you Site and Category for the trigger and click "Add Trigger"
Select from the dropdowns in the boxes. It is important to remember when setting up triggers that you are setting up a trigger for when to be alerted, not your limit i.e. you approval limit it less than 20, the trigger must be set to alert when it is greater than 20.
For Value type there are multiple options:
Absolute Value :

Use this value type for a simple min and max trigger limit
Conditional Value:

Use this type to set up a trigger which varies depending on a the conditional value at another station
Exceedance over Multiple Readings:

Use this type if the trigger if related to consecutive exceedances or percentiles. Select which under Fire when.
Rainfall conditional value:

Use this type if the trigger if the trigger limit is variable depending on rainfall (entered into the meteorological data section)
Relative to Other Station

Use this type if the trigger if the trigger limit is relative to another station, it can be + or - or a percentage of the value at the other station.
Relative to Other Station and variable
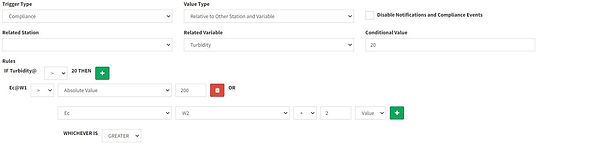
Use this type if the trigger if the trigger limit is relative to another station and another variable, it can be + or - or a percentage of the value at the other station and involves a whichever is greater or lesser.
Relative to previous value

Use this type if the trigger if the trigger limit is relative to the value of the last event recorded in the system.
Once trigger is set up, press Add Trigger. The system will ask if you would like to add another trigger, by selecting yes, you can use the same trigger settings for the next station. If you select no you will be directed tot he trigger page where you can see a summary of triggers set up.
You can use the copy function to Copy a trigger setting from one station to another.
Attach SOP to a Trigger
By selecting edit you can attach a SOP document to the trigger. It should contain instructions on what to do in the case of the trigger being met.
Select 'Link SOP Documents' (green button in the right hand corner). Select an SOP document and Link. If the SOP is not avalible you will need to uplaod it through documents (See Documents).
If the trigger is met the SOP will be attached to the Email notification.
Attach Compliance Form to a Trigger
If a trigger requires an investigation, report or notification to be undertaken, a form can be provided to complete on the trigger being met. It will be automatically generated and attach to the event. A link to this form is available on the email notification and on logging into the system.
Forms will need to be set up by the GPlus Live administration team.
To attach a compliance event to to a trigger, select edit next to the triggers and press "Link Compliance Event Settings' (green button in the right hand corner).
User Trigger Alerts
To set up who receives Trigger Alerts on the Trigger summary page select "Permissions" (orange button in the top right corner). Useres will receive all trigger which are of a certain type. Select which users will receive which type. All users with access to your site will be available on the list, which includes Groundwork Users. The type of notification for each trigger type should already be set up under the trigger type settings
Trigger Summary and Notifications
A summary of the triggers for your site is available under compliance, Notifications. A summary of all the triggers which have been recorded on the site is also available here. You can record any actions taken and close off a trigger event from this page for your record keeping purposes.

Click on Details to go to the event page
Click on Action to record actions taken and close off an event
Documents
Any environmental relevant documents can be uploaded to the site under Documents.
I register of uploaded documents, including attachments within events, is displayed on the page. It can be searched and sorted. You can also use the different types of documents to narrow the register down.
To download click on the blue hyperlink.
To Upload a new document select Upload New Document. Provide information relating to the document and press 'browse for file'.

Site: to site the document relates to
Tag: put any words relating to the document for searching
Document type: Choose from drop down list for best suitability. Further types can be created on request
Date: Date on document
Attach document
Description: provide a description of the document, title of the document
Save
Standard Operating Procedures
Select Documents and SOP Documents.
A register of available SOP document is displayed. This is a list of all SOPs for the company (not only the site) to ensure consistency across companies.
Click on the blue hyperlink to download.
Select Upload New Document in the right hand corner to upload a new SOP. Complete the form and upload ensuring the Description is concise as it will show for attaching to events. Include the site name if it is site specific in both the tag and the description.
Summaries
Select Document.
Summaries provides a register of generated summaries events, click on the blue hyperlinked date to download.
You are able to generate a period summary from this view by selecting Generate New Summary. This process allows the user to generate a summary of multiple monitoring events. All data, comments, discussions, photos and meteorological information for those event will be displayed in the summary report as a stand alone summary. The purpose and site information including a map of the monitoring locations is also provided. The user can select which stations and variables to include in the report.

Category: which category do you want to generate the summary for
Discussion: provide a discussion around the data being summaries. This will be presented in the report.
Stations : Select which stations data to include in the report
Chart variables: Select which variable's data to include in the report
Period: Select the reporting period, the summary will include data from all events within that period.
Site : which site do you want to generate the summary for
Registers
Select Documents and Registers.
A display of the registers available to the site are displayed. To add or edit a register, contact the team at Groundwork Plus.
Add view or input data to a register, select view in to the right of the register. Users can also download to excel or PDF from this view.
Once in a register, completed lines are displayed on the top while a blank line is provided below.
Insert your information to the boxed and press add row. The new information should be available in the top section.
You can edit or delete by selecting edit or delete from a completed row. When you select edit, the data will appear in the bottom section again, make your changes and press add row. Registers automatically save on pressing add row.

Top section displays inputted data. Can be edited or deleted here
Enter data here and press add row.
Site Maps
Select Locations - Site Map.
Select the site and category you wish to view. The map will automatically zoom to show the locations. The map is either Google or Bing depending on access.
Clicking or hovering over the pins will show details of the location and link to the latest data.
Some users can add and edit stations. They can be added by clicking the location on the map and providing details.
Stations can also be added or edited under Locations - Stations menu.
Note if a station is only being used for a period of time (eg for one assessment or for a specific event) you are able to add available from and to dates to avoid overcrowding the data entry pages.
The sort order is the order the stations will be displayed on the data entry pages, 1 being the top.
